Toolkit

INTRO
The strategic foresight ‘toolkit’ presented here should be understood as a flexible composition rather than a rigid hierarchy. These tools are building blocks that can be mixed, matched, layered, and adapted to the brand’s specific needs.
The 'TOOLKIT' page provides depth on each tool, how they work, when they prove most valuable, and how they combine with other tools.

One example of this concept is Sohail Inayatullah and Ivana Milojević’s Six Pillars approach (image above) to futures studies. It is a flexible framework where different tools and methods can be combined and adapted based on context.
Six pillars equal to six steps:
• Mapping the future (understanding current context)
• Anticipating (emerging changes)
• Timing the future (evolutionary patterns)
• Deepening the future (underlying worldviews through Causal Layered Analysis)
• Widening (scenarios and visions)
• Transforming the future (strategic change).
• Different tools have different goals and scopes
• Tools can nest within each other
• Tool selection depends on strategic questions
• Tool effectiveness depends on organisational context
• Tools create a common language
ENVIRONMENTAL SCANNING
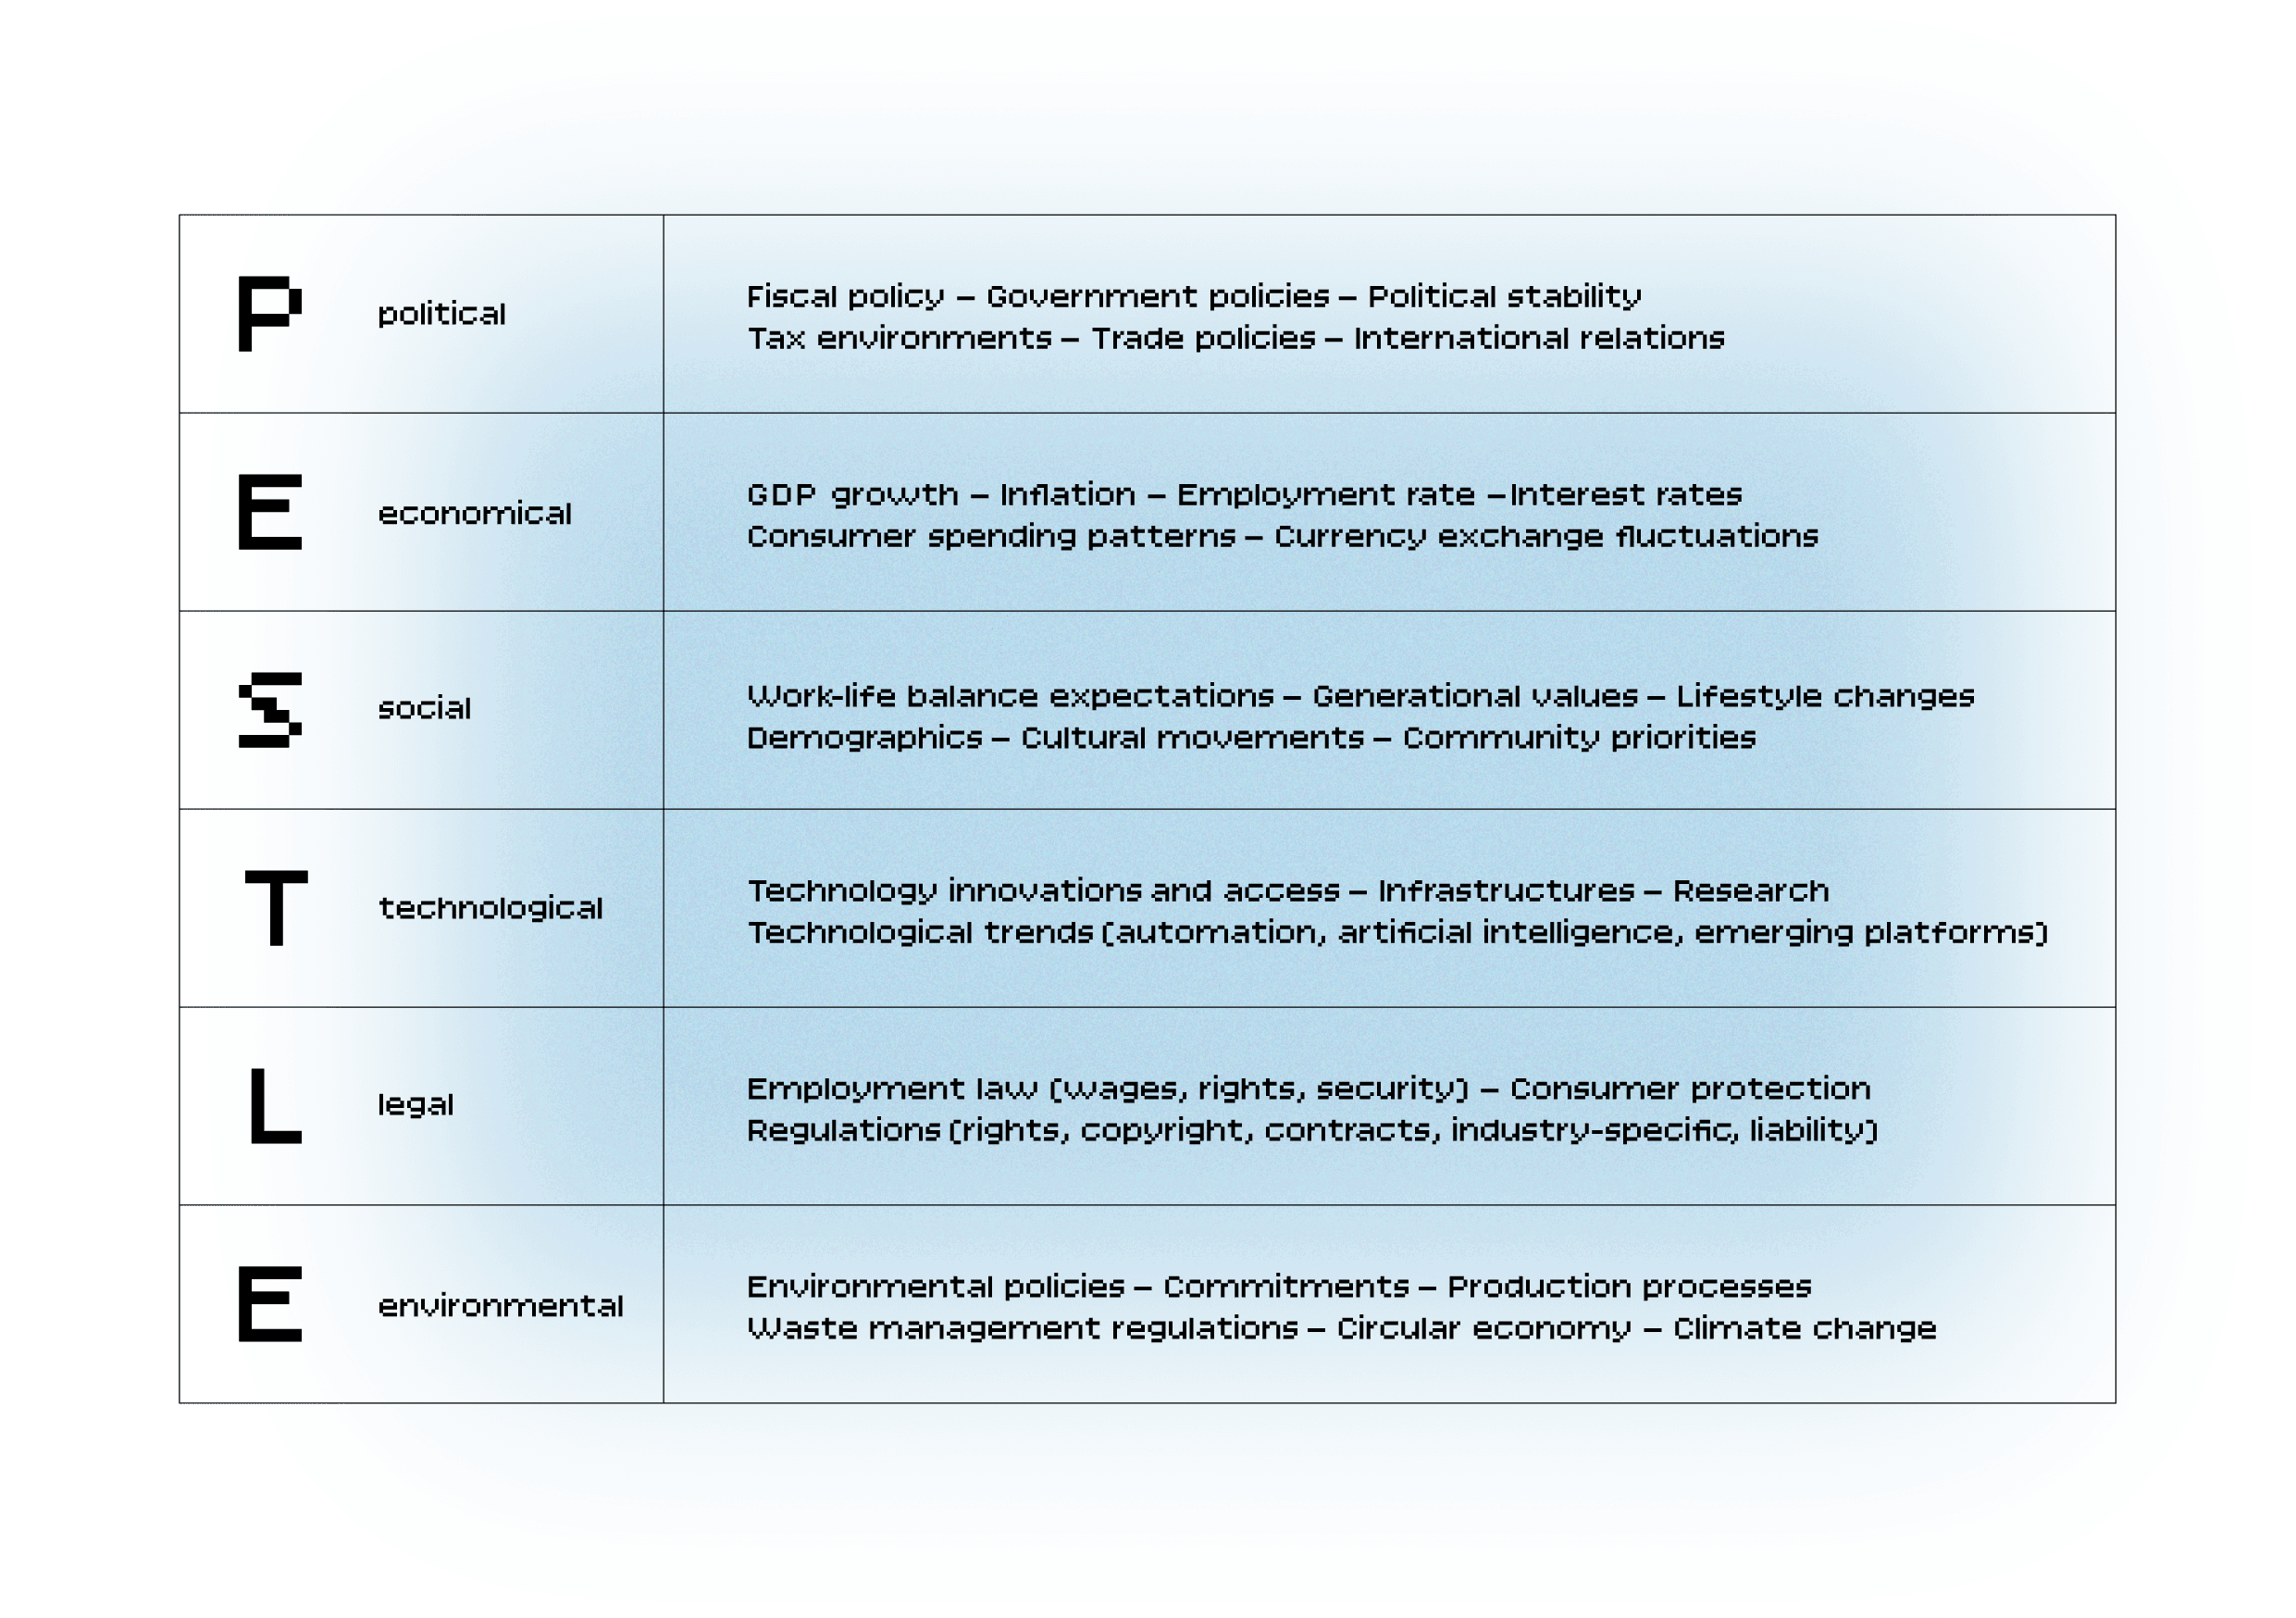
PESTLE, expanded from PEST, became standardised in strategic planning during the 1990s, building on earlier environmental scanning approaches. It’s purpose is to systematically scan the external environment across six key dimensions without missing important forces. The human mind naturally organises complex information into categories. PESTLE provides six logical categories – Political, Economic, Social, Technological, Legal, Environmental – that capture most external forces affecting organisations.
PESTLE consists of a simple six-factors framework, so a physical template, digital spreadsheet, or a whiteboard can be divided into sixths. For each section, these aspects should be brainstormed:
• What forces exist in this dimension currently?
• What changes are already underway?
• What emerging developments might affect the brand?
• What emerging developments might affect the brand?
• What decisions or developments might the brand influence?
• What’s completely outside the brand’s control?
PESTLE findings feed into:
• signal detection: what signals suggest emerging changes in each dimension?
• pattern recognition: how do changes across different dimensions interact?
• scenario development: how might combinations of changes across these dimensions create different futures?
Therefore, it might be interesting to speculate possible future implications andnote how the brand relevance ties to the PESTLE states.
Finally, many practitioners add an additional ‘E’ for ethical considerations, creating PESTELE or STEEPLE, while others add Cultural as separate from Social. The key principle is scanning all significant external forces rather than missing important dimensions.

Amy Webb, renowned futurist and founder of the Future Today Strategy Group (FTSG), developed CIPHER as systematic approach to identifying weak signals indicating emerging trends and patterns. Rather than waiting for obvious trends, CIPHER prompts deliberate searching for six specific signal types.
The framework can be the first tool to be used for horizon or environmental scanning, but it can also be a way to find patterns among information gathered through the PESTLE analysis.
In each section, there should be another layer of order in terms of urgency, priority or relevance, so to eventually be able to easily narrow down the project’s focus and core questions.
CIPHER can be implemented in the organisational foresight system to detect signals and monitor change, weekly, monthly, quarterly and annually.
After organising information in the framework, one can then identify the brand’s own uncertainties and their consequences.

Whilst CIPHER identifies signal types, ASCENDS, ideated by strategist and designer Jay Whittaker, provides an analytical framework for understanding signal implications. It is also a useful analogy that describes the inflection point, the upwards tick of the growth curve, as a trend takes hold.
The model can be used to put a signal in context and raise further questions about when it might take off and the potential impact. The two frameworks can work together, as CIPHER catches signals, while ASCENDS interprets them.
• Abundance
If the weak signal was to take hold and form a trend, what activity or resource might become newly abundant? What is currently abundant, more available, accessible, or cheaper, that might be impacted?
E.g.: information becoming universally accessible, so knowledge democratisation, or manufacturing capabilities becoming accessible to smaller players, like 3D printing or digital tools.
• Scarcity
What’s becoming more limited, restricted, or expensive? What current scarcity might be addressed? What new scarce activity or resource might emerge? This is beginning to step into second order effects, which can be notoriously hard to accurately predict. Instead the goal is to exercise the organisational ability to observe and recognise settling trends sooner.
E.g.: decreasing attention in increasing information-rich environment or decreasing trust as credibility questions multiply.
• Collisions
Where are different trends, forces, or technologies intersecting? What other trends or factors might A and S collide with? Here, ideas, observations and trends must be brought together to see where they might connect, form feedback loops or run against each other.
E.g.: artificial intelligence meeting healthcare, enabling new diagnostics and treatments, or sustainability requirements meeting cost pressures, driving innovation in efficient models.
• Exponentials
What’s experiencing rapid, accelerating growth? Are there factors that might cause the growth to become exponential? Are there early signs of behaviour or effects that seem small, but are gathering steam quickly?
E.g.: data generation and processing capabilities, so exponential growth in available data.
• Novelty
What’s genuinely new, unprecedented, or previously impossible? The concept must be understandable. Some innovations come too early or have not yet been refined to a point where they can be adopted. Is there something different this time? Is there another trend that might collide and suddenly make it understandable to the public?
E.g.: completely new business models like platform economies, subscription services models, or novel social behaviours and structures like remote and smart working.
• Democratisation
What previously exclusive capabilities, tools, or opportunities are becoming widely accessible? Is there something that could cross a previous barrier?
Is our assumption that it is an edge case, a niche or product for the rich only about to be challenged?
E.g.: advanced analytics tools becoming accessible to small businesses, or global market access for local producers through e-commerce platforms enabling anyone to reach worldwide customers.
• Slowers/Stoppers
What forces are adding friction or reactions that limit progress? Are there signals that a counterflow is forming? What barriers or complexity might delay change? Similar thinking will be employed again at later stages, but with a lens more focused on the current context and organisation.
E.g.: regulatory barriers to emerging technologies, cultural resistance to new behaviours, values and technology, or innovations remaining too expensive for mass adoption.
Using ASCENDS
• Starting with signals identified through CIPHER
• Categorising each signal using ASCENDS dimensions
• Examining implications: ‘if this signal strengthens, what becomes possible or impossible?’
• Looking for patterns: are multiple ASCENDS dimensions pointing to similar strategic implications?
• Connecting to strategic questions: How do these signals affect our specific strategic decisions?
Integrating CIPHER and ASCENDS
CIPHER and ASCENDS work together as signal detection system. CIPHER helps identify signals worth analysing. ASCENDS provides analytical framework for understanding implications. Together they transform scattered observations into strategic intelligence.
PATTERN RECOGNITION & UNCERTAINTY FRAMING
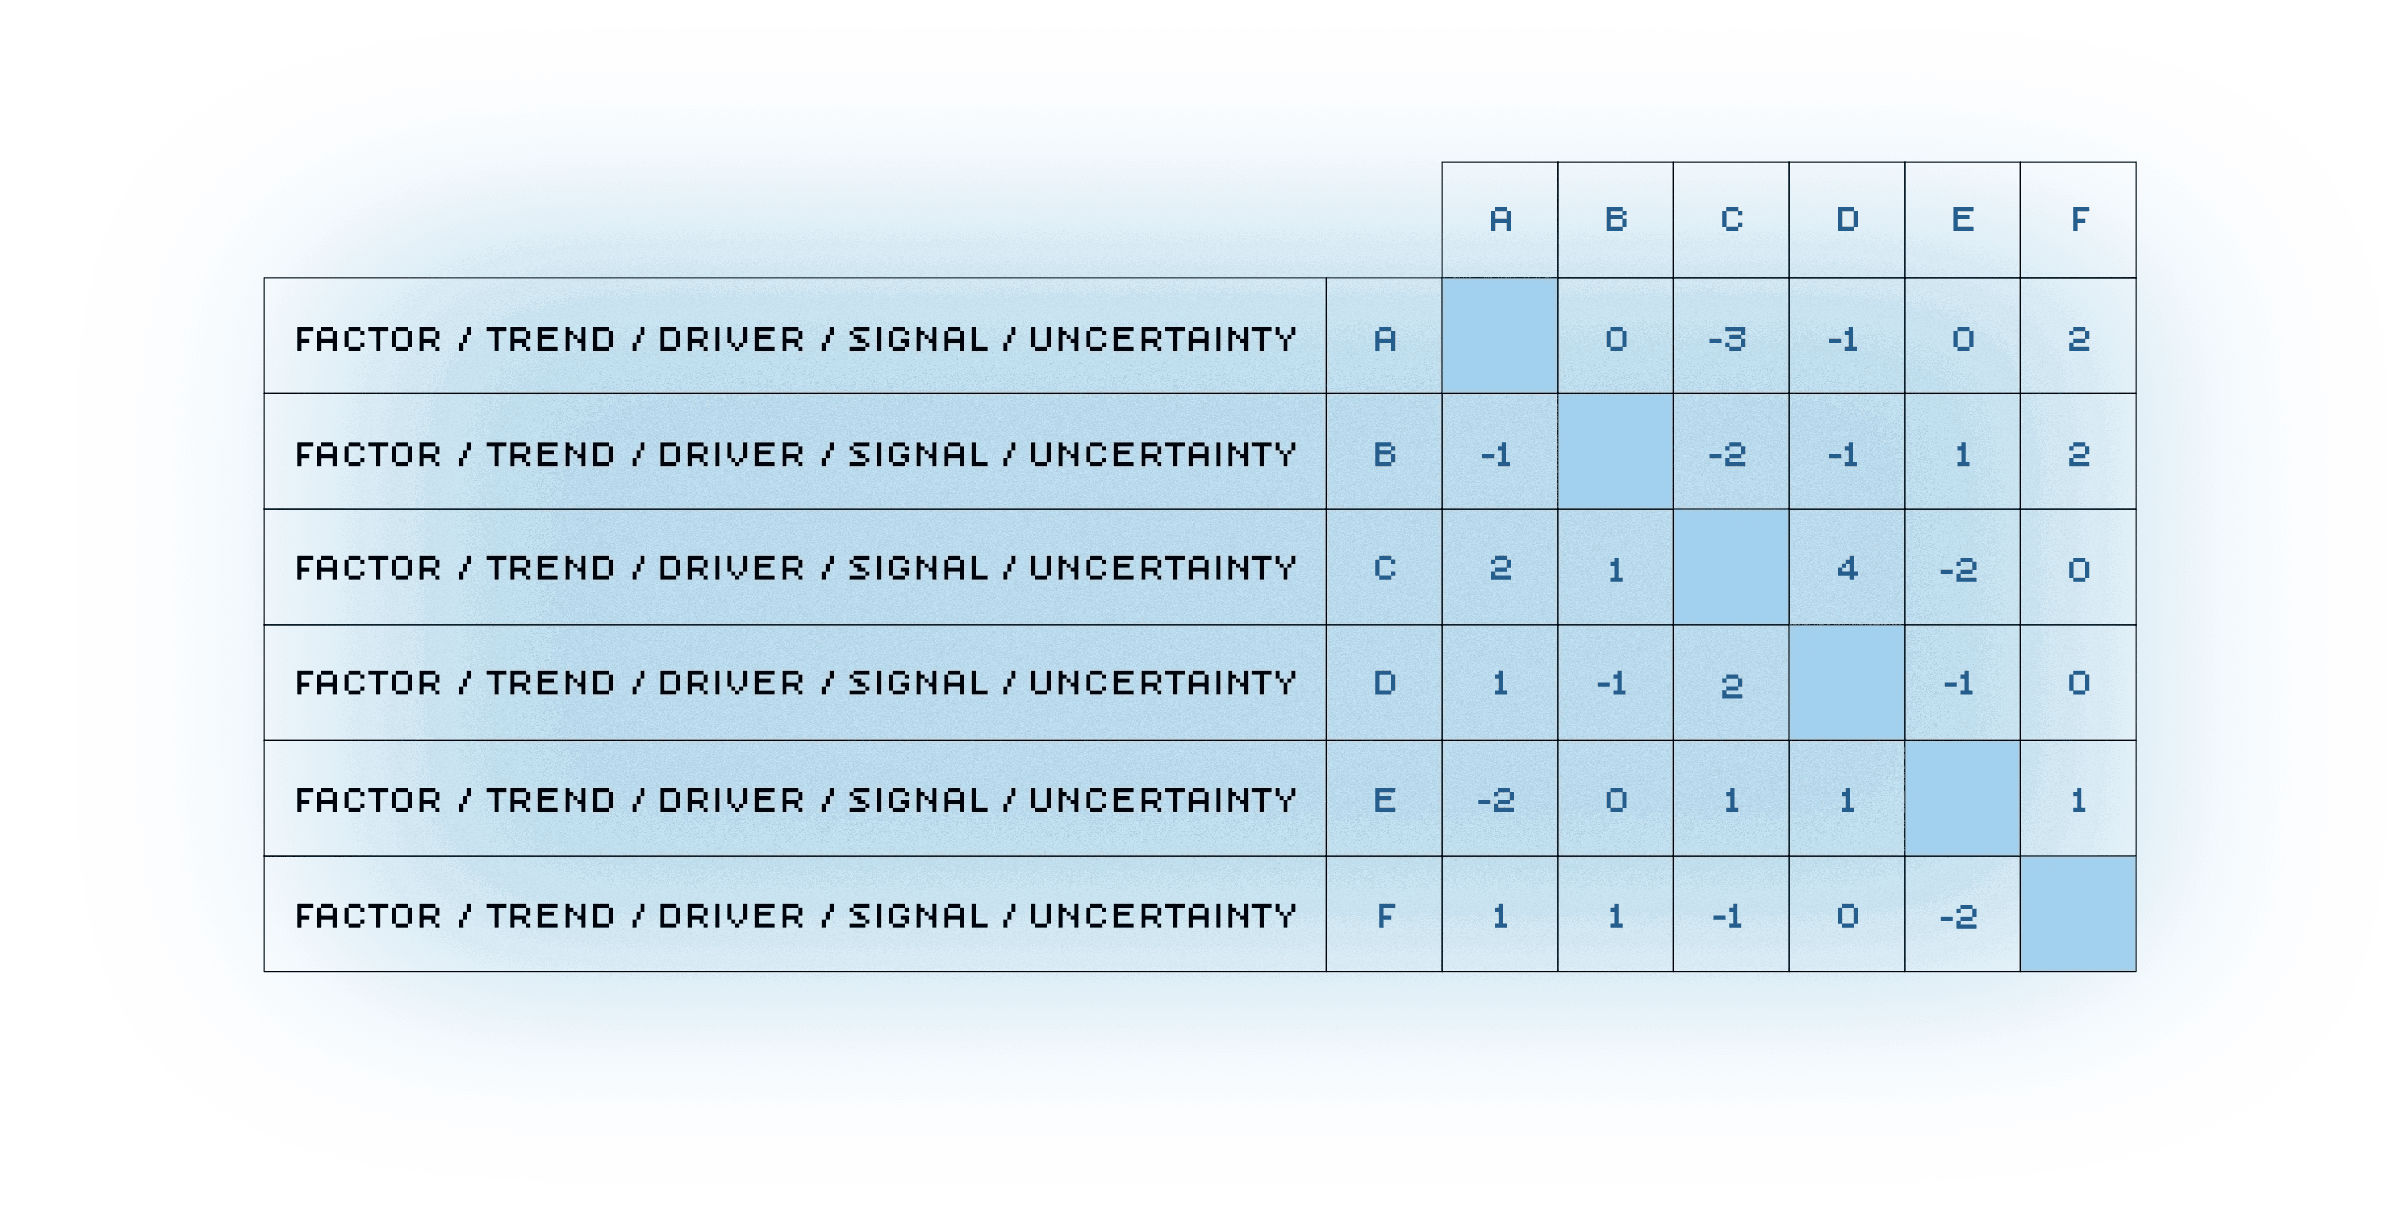
Theodore Gordon and Olaf Helmer first developed the cross impact-matrix method of analysis in 1965 in a game called ‘Futures’ for Kaiser Aluminum and Chemical Company on the occasion of their 50th anniversary. The purpose of the matrix is to map how different trends, forces, and developments might influence each other, revealing reinforcing loops, surprising interactions, and hidden dependencies.
This model works because strategic contexts are rarely determined by single forces, so it’s crucial to understand the multiple forces that interact with each other, sometimes reinforcing each other (creating acceleration), sometimes constraining each other (creating tension), to define changes.
To conduct a coss-impact analysis
1. List of key factors (typically 6-12), which may be identified as trends, drivers, forces from PESTLE analysis, or critical uncertainties.
2. Creation of a matrix with factors, trends, drivers on both axes (rows and columns). If one has 8 factors, then they’ll have an 8×8 matrix.
3. Assess of influence of each intersection cell through asking ‘How does factor in row influence factor in column?’ and using the following scoring:
• +2 > Strong positive reinforcement (Factor A accelerates Factor B)
• +1 > Moderate positive influence (Factor A helps Factor B)
• 0 > Neutral or no significant interaction
• -1 > Moderate negative influence (Factor A constrains Factor B)
• -2 > Strong negative conflict (Factor A prevents Factor B)
More points (+/-3, +/4) can be added depending on number of factors and therefore depth of influence to be noted.
Pattern identification
• Which trends reinforce each other (columns with more +2 & +1 scores)?
• Which trends conflict with each other?
• Which trends have no interactions (isolated)?
• Where are the cascade effects (one trend amplifying another)?
• Scoring of factor intersections can change overtime, but the important thing to note is growth potential, relevance for the brand, and possible follow up actions.
Example application
• Identified factors:
- Digital transformation adoption
- Generational value shift toward sustainability
- Supply chain disruption
- Regulatory pressure on environmental practices
- Customer demand for transparency
- Rise of remote work
- Competitor digital investments
- Economic uncertainty
• Creating cross-impact matrix reveals:
- Digital transformation + customer transparency demand = digital enables transparency (reinforcing loop)
- Supply chain disruption + competitor digital investments = disruption costly, competitors investing heavily anyway (tension)
- Economic uncertainty + regulatory pressure = new regulation during uncertain times creates implementation challenges (conflict)
- Generational value shift + transparency demand = younger generations demand transparency aligned with their values (reinforcing loop)
• These patterns suggest strategic priorities: invest in digital capabilities for transparency (high-leverage), manage supply chain disruption carefully, and time regulatory compliance strategically.
• Strategic options analysis:
- Identify which reinforcing loops to amplify (invest in, accelerate)
- Identify conflicts to manage (hedge strategies, staged implementation)
- Identify which factors are critical leverage points (changes in these disproportionately affect everything else)
- Identify which factors are vulnerable to disruption (require protection, redundancy, or monitoring)
E.g.: If ‘increasing automation’ scores +2 with ‘demand for high-skill jobs’ because automation removes routine work while creating demand for robot maintenance and programming, the analysis will have identified a reinforcing loop. This reinforcement makes both trends more powerful together than separately.
• Strategic implication: reinforcing loops deserve concentrated strategic attention because they create compounding effects. Conflicting trends might require different strategic responses depending on which dominates.

It was invented by Jerome C. Glenn in 1971 at Antioch Graduate School of Education, evolved through versions developed with Theodore Gordon that added categorisation by sector (economic, technological, political, environmental, etc.) and time horizons.
The purpose of this method is to identify and visualise direct and indirect consequences of trends, events, or decisions, enabling systematic exploration of second and third-order effects that simpler analysis misses.
Not only can it be used for pattern recognition, but also for scenario development to understand implications of key trends.
How to create a futures wheel
• Placing a main change or trend in centre of page (e.g., ‘widespread automation adoption’)
• Identifying direct consequences around the centre (first ring):
- More joblessness
- Greater productivity
- New job categories emerge
- Reduced labour costs
- Increased inequality risk
• Identifying secondary consequences (second ring) flowing from the direct consequences:
- If ‘more joblessness’ and ‘increased inequality’, then ‘social tension and political instability’.
- If ‘new job categories’ and ‘greater productivity’, then ‘retraining needs and skills shortages’.
- If ‘reduced labour costs’, then ‘increased profitability for companies, price reductions for consumers’.
• Exploring tertiary consequences (third ring or beyond):
- If ‘social tension and political instability’, then ‘regulatory changes, policy shifts, investment in retraining’.
- If ‘skills shortages’, then ‘educational system transformation, immigration pressure, salary inflation in technical fields’.
• Marking relationships:
- Connecting lines to show cause-effect relationships
- Concentric circles to help show consequence levels
- Colours to indicate categories (economic, social, environmental, etc.)
Variations
• Impact Wheel: focuses on negative impacts and mitigation strategies
• Implementation Wheel: focuses on implementing a planned change and its consequences
• Time-Sensitive Futures Wheel: adds time dimension showing when consequences likely emerge
The Futures Wheel prevents assumption that trend leads to simple outcome. Instead, it reveals complex web of consequences the organisation will need to navigate.
It was developed by Simon Wardley (2004 onwards), evolving from his work on mapping strategic positioning and value chain dynamics. Its purpose is to provide a visual method to understand how value chains evolve over time, particularly useful for scenario development and identifying emerging competitive advantages or vulnerabilities.
The tool reveals which competitive advantages are sustainable versus temporary, and how market dynamics might evolve under different scenario conditions.
Different components of value delivery evolve through stages: Genesis (novel, undefined) > Custom (tailored, differentiated) > Product (standardised, competitive) > Commodity (utility, price-competitive)
Creating the map
1. Mapping value chain for the brand:
• Identifying user need, what customers actually want
• Working backwards through everything required to deliver that need
• Identifying all components, from customer-facing offerings to underlying infrastructure
2. Classifying each component by evolution stage:
• Genesis: Rapidly changing, poorly understood, novel capabilities
• Custom: Mature enough to be useful but still tailored to specific contexts
• Product: Standardised, feature-competitive, ‘good enough’ but not differentiated
• Commodity: Standardised utilities, competing on price
3. Creating Wardley map, plotting each component on axes:
• X-axis: evolution stage (Genesis – Commodity)
• Y-axis: value chain position (visible user needs – underlying infrastructure)
4. Analysing strategic gameplay:
• Genesis components: where can the organisation create new value through innovation?
• Custom/Product components: what differentiates the brand? What could become commodity?
• Commodity components: can the business build or buy? What’s most cost-effective?
5. Creating alternative Wardley map for each scenario:
• How might component evolution trajectories change?
• What components might shift evolution stages?
• Where might new components emerge?
• How might competitive advantages appear or disappear?
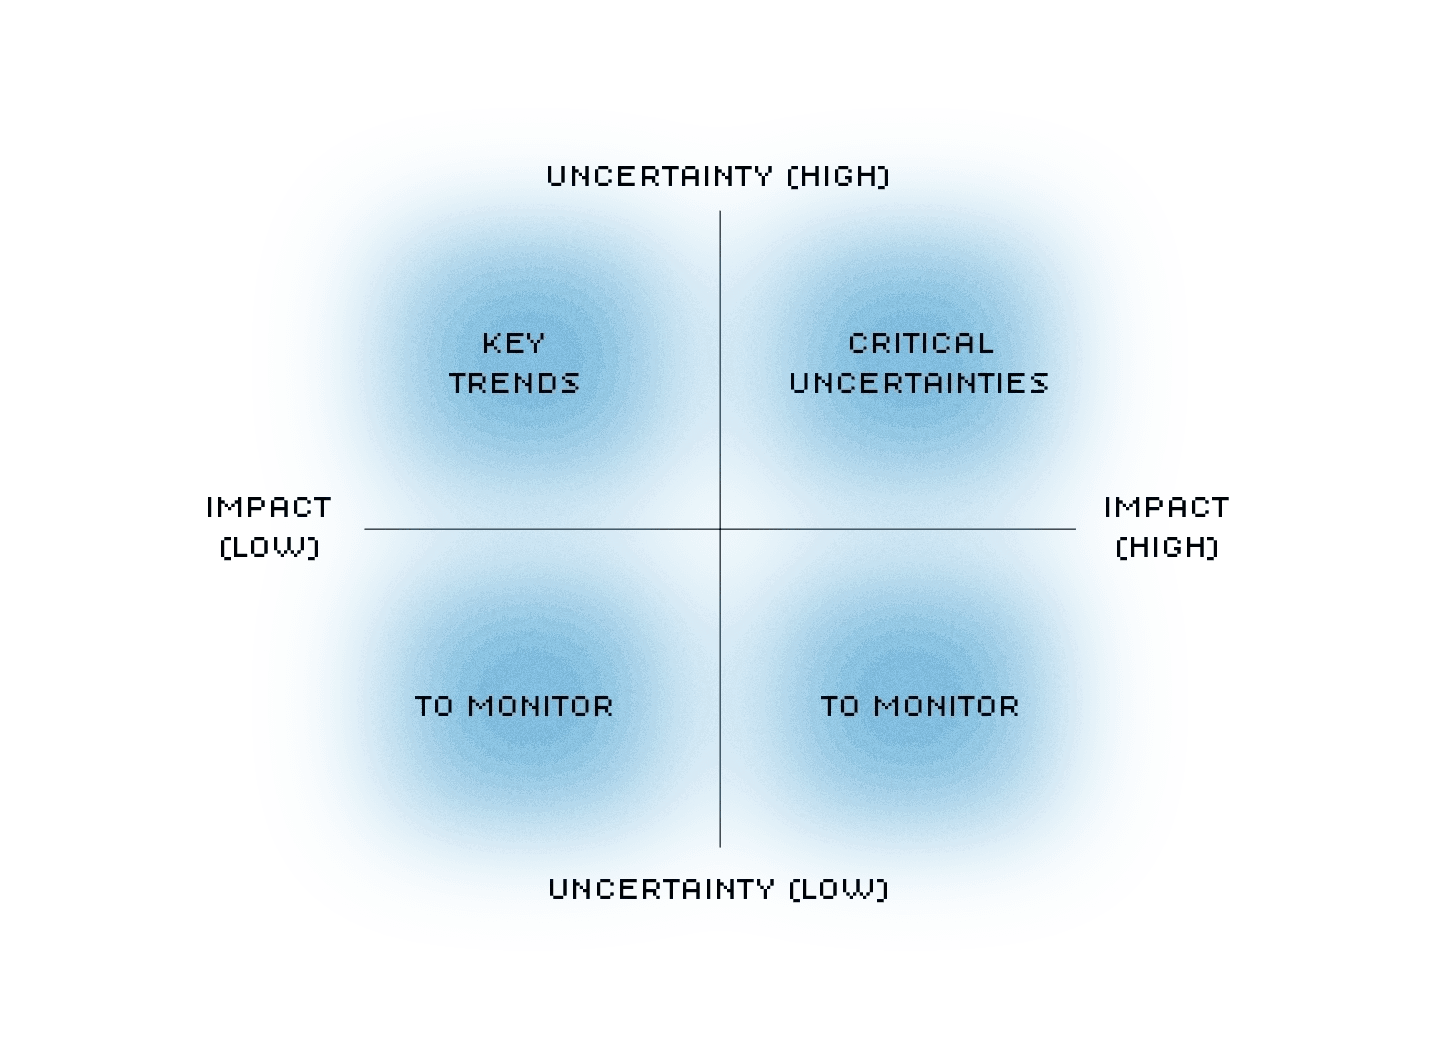
In 2010, Torsten Wulf and colleagues at the HHL Leipzig Graduate School of Management and Roland Berger Strategy Consultants developed the tool as part of a comprehensive six-step scenario-based strategic planning approach.
The purpose of the matrix is to distinguish critical uncertainties deserving strategic attention from interesting but strategically peripheral factors. It helps focus limited resources on factors that could fundamentally affect brand strategy.
To create an impact/uncertainty matrix
1. List of all trends, forces, and developments identified during the environmental scanning.
2. Rating of impact on brand strategy using 1-5 score:
• 1: Minimal impact on brand strategy
• 3: Moderate impact requiring tactical adjustments
• 5: Fundamental impact potentially requiring strategic repositioning
3. Rating of uncertainty using 1-5 score:
• 1: High predictability; future development is clear
• 3: Moderate uncertainty; several plausible directions
• 5: High uncertainty; equally plausible alternatives
4. Plotting impact on Y-axis (vertical) and uncertainty on X-axis (horizontal)
5. Quadrants analysis:
> High impact, low uncertainty (to prepare for)
• These are trends that will affect the brand and are predictable
• Require focus on preparation and operational planning
• All scenarios should incorporate these developments
E.g.: demographic shifts (predictable but impactful), regulatory requirements (often knowable far in advance)
> High impact, high uncertainty (to focus as scenarios)
• These are the brand’s critical uncertainties
• They fundamentally affect strategy but remain genuinely unpredictable
• Require creating scenario frameworks around these
• Require monitoring and adjustment as uncertainty resolves
E.g.: technology adoption speed, competitive disruption, customer value shifts
> Low impact, low uncertainty (to monitor)
• These trends exist but don’t affect strategy significantly
• Require monitoring for unexpected amplification
• Useful for contextual understanding but not strategic focus
E.g.: academic trends not affecting the business sector, technical standards used elsewhere
> Low impact, high uncertainty (to monitor)
• These trends are unpredictable but affect strategy minimally
• Require maintaining awareness for wild card emergence
• Interesting but not requiring strategic prioritisation
E.g.: emerging technologies not yet applicable to the business’ sector, social movements not affecting the brand’s customers

This visualisation was developed by Dr. Sohail Inayatullah (1997, published 2001), created as an evolution from earlier work on the litany and grounded in Tantric epistemology and Fred Polak’s ‘Image of the Future’.
Its purpose is, here, to visualise three forces shaping the brand’s evolution, meaning what it wants to move toward (pull), what’s pushing it forward (push), and what’s holding it back (weight).
Strategic change always involves navigating tension between desired futures, emerging trends, and resistance from the past. Visualising these forces helps balance strategic attention.
To create a futures triangle
• Drawing a triangle with three points:
• Pull: aspirational vision and preferred future of the brand
• Push: Emerging trends and external forces accelerating in particular directions. What’s pushing the brand forward?
• Weight: Resistance from the past. What’s holding the brand back? Inertia, stakeholder concerns, legacy systems, outdated assumptions?
Pull of the Future (Vision)
• Images, visions, and aspirations for what we want to create
• Brand positioning and desired future state
• Customer aspirations and ideal experiences
• Stakeholder hopes and desired outcomesPush of the Present (Drivers and Trends)
• Current forces, technologies, and developments actively pushing change
• Market momentum and trend trajectories
• Economic and technological drivers
• Social movements and shifting values
• Quantifiable changes and measurable momentumWeight of History (Past Constraints)
• Accumulated assumptions, systems, and structures from the past
• Organisational culture and established practices
• Stakeholder beliefs and comfortable patterns
• Legacy systems and investments
• Historical identities and established relationships
For each strategic question, elements should be positioned on the triangle.
Example application: digital transformation
• Pull (Vision): ‘become seamlessly integrated with customers’ digital lives, enabling effortless service access and personalisation’.
• Push (Trends): customer expectations for digital convenience, competitor digital investments, technology enablement.
• Weight (Resistance): workforce unfamiliar with digital tools, customers preferring personal relationships, regulatory constraints.
• This visualisation immediately shows: ‘we have strong push and clear pull, but weight of legacy resistance might constrain progress. Strategy should focus on addressing weight, like legacy modernisation and workforce development, not just pursuing pull or riding push’.
Implications
• When weight is more dominant, strategic focus is overcoming resistance, building credibility, addressing concerns.
• When push is more dominant, strategic focus isriding momentum, scaling quickly, capturing advantage before competition.
• When pull is more dominant, strategic focus is creating compelling vision, building aspiration, inspiring commitment.
• When all three are balanced: strategic focus is directional movement, adjusting priorities as conditions evolve.
Integration with other tools
The Futures Triangle works well alongside Causal Layered Analysis (the Weight of History often reveals worldview and metaphor challenges) and with scenarios development (each scenario creates different balance between the three forces).
SCENARIO DEVELOPMENT
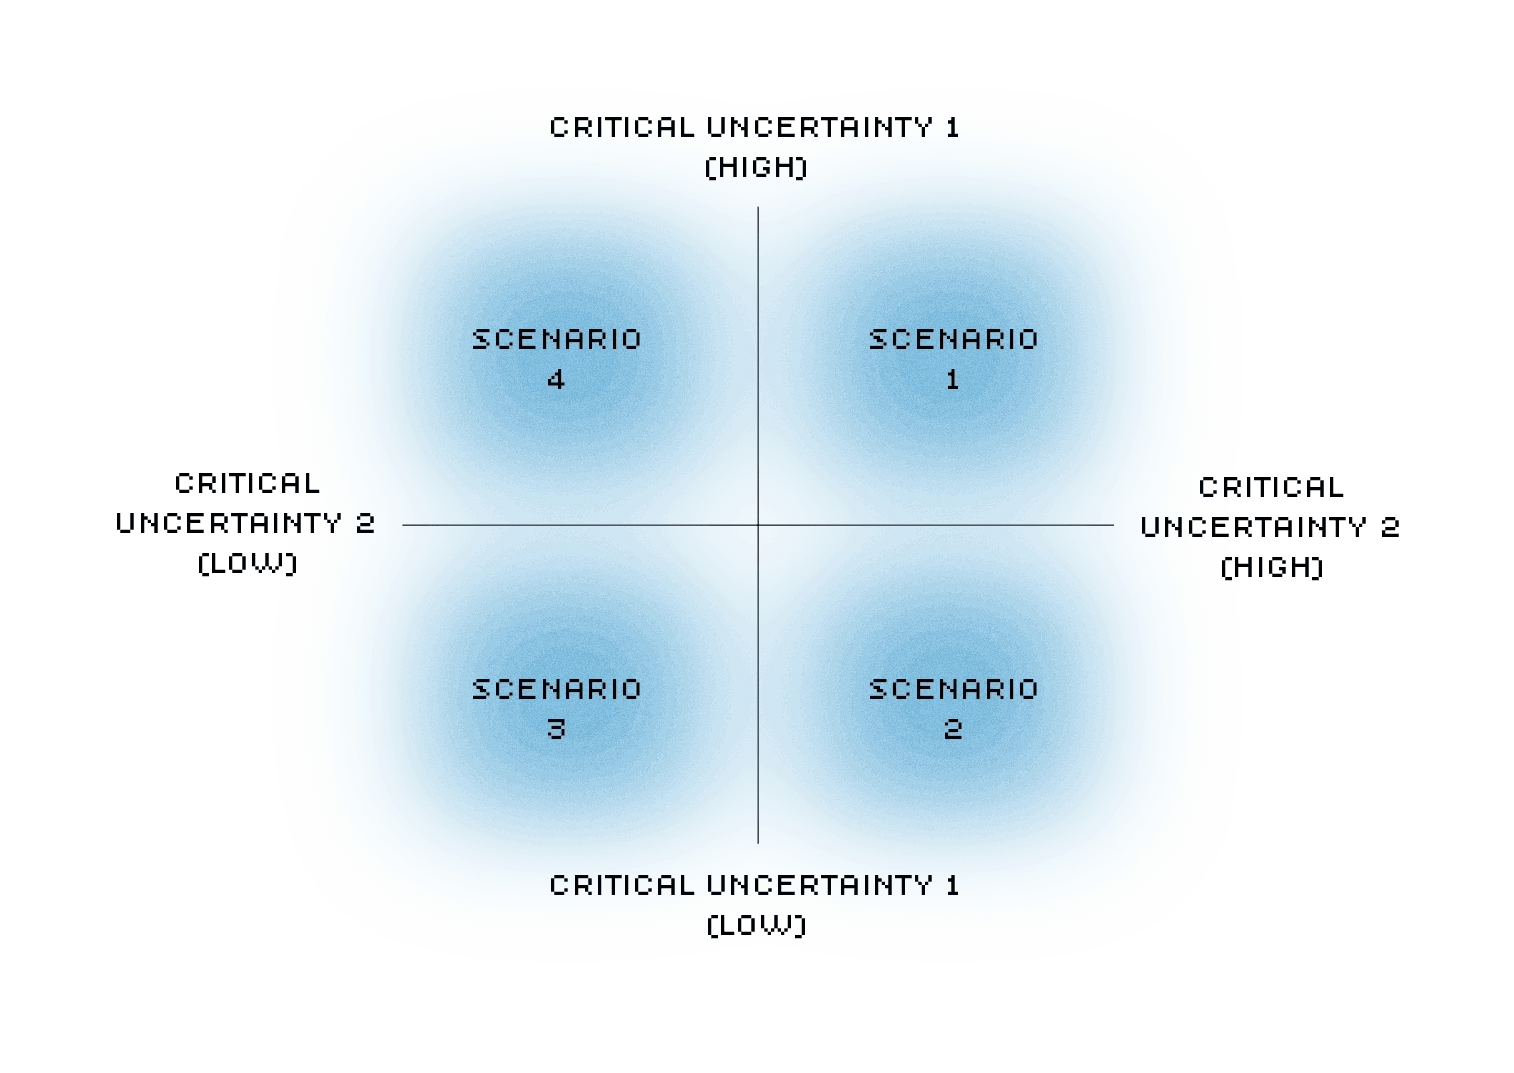
The 2x2 approach was formalized during the 1990s by the consulting firm Global Business Network (GBN). In 1996, Peter Schwartz, co-founder of GBN, published an account of the 2x2 approach as an appendix to his seminal book The Art of the Long View, which became a foundational text for scenario planning. It’s what Fuel4Design calls ‘Polarity Mapping’. It works best when it follows the Cross-Impact analysis, as it is used to create four contrasting scenarios in regard to the high uncertain/high impact drivers.
Its purpose is to use two critical uncertainties as axes to create four distinct but plausible scenarios that capture meaningfully different futures. In this tool, two independent critical uncertainties create two-by-two matrix naturally yielding four quadrants, namely four scenarios providing enough variety to challenge assumptions without overwhelming complexity. Two dimensions capture key uncertainties without requiring complex morphological analysis.
Creating the matrix
1. Selecting two independent critical uncertainties (from Step 5 analysis):
• ‘Independent’ means resolution of one doesn’t determine resolution of other
• ‘Critical’ means they significantly affect the business’ strategic decisions
• ‘Uncertainties’ mean multiple plausible outcomes exist
Example uncertainties:
• Uncertainty 1: ‘Will artificial intelligence enable or, on the contrary, reduce human connection?’ (X-axis)
• Uncertainty 2: ‘Will economic models become more or less equitable?’ (Y-axis)
2. Defining axis endpoints (representing spectrum, not binary choice):
Specific, measurable endpoints rather than vague terms,:
• X-axis left: ‘AI primarily used for efficiency, reducing human interaction’
• X-axis right: ‘AI primarily used for augmentation, enhancing human connection’
• Y-axis top: ‘Economic equity improves as wealth distributes more broadly’
• Y-axis bottom: ‘Economic inequality increases as wealth concentrates’
3. Naming four quadrants with memorable, value-neutral titles that capture essence. Each quadrant represents unique combination of the two uncertainties and should create meaningfully different strategic context.
• Top right quadrant: ‘Augmented Abundance’ (enhanced connection, equitable economics)
• Bottom right quadrant: ‘Algorithmic Divide’ (augmented connection, concentrated wealth)
• Bottom left quadrant: ‘Efficient Inequality’ (reduced connection, concentrated wealth)
• Top left quadrant: ‘Connected Commons’ (human connection, equitable economics)
When naming:
• Avoiding generic names (‘Scenario A’, ‘Best Case’)
• Avoiding value-laden names (‘Success’, ‘Failure’) biasing interpretation
• Using names that capture essential character (‘Marketplace Commons’, ‘Digital Transformation’, ‘Resilient Localism’)
4. Developing scenario descriptions (2-3 paragraphs each) describing what the brand world looks like in each scenario. What would success look like? What challenges would emerge? How have customer needs, competitive dynamics, and value creation evolved?
Scenarios Quality Criteria
• Plausibility: Could each scenario emerge from current conditions?
• Differentiation: Does each scenario create meaningfully different strategic contexts requiring different brand responses?
• Relevance: Do scenarios address uncertainties that actually affect the brand strategic choices?
• Memorability: Can stakeholders easily remember and discuss scenarios without constant reference materials?
Strategic testing
• Which strategic approaches work well across all scenarios, which work in some scenarios but fail in others?
• What early warning indicators suggest which scenario is emerging?
• What would the scenario prioritisation be if they became probable?
Limitations of using the matrix
• May oversimplify complex reality as it might miss important uncertainties
• Assumes independence of axes

It was invented by Fritz Zwicky in the mid-1940s as a creative method within the aeronautics sector, but was then introduced to foresight studies in the 1990s. Its purpose it to generate comprehensive alternatives by systematically exploring combinations of different variables affecting the business’ strategic context. This is particularely useful when 2×2 matrices feel too simple but overwhelming complexity wants to be avoided.
Using the analysis
1. Defining up to 5 key variables that significantly affect the organisation’s strategic context (e.g., ‘Technology adoption speed’, ‘Regulatory intensity’, ‘Consumer values orientation’, ‘Economic conditions’)
2. Identifying 2-3 possible states for each variable:
• Technology adoption: Slow / Moderate / Rapid
• Regulations: Light / Moderate / Heavy
• Consumer values: Individual-focused / Balanced / Collective-focused
• Economy: Growing / Stable / Declining
• Competitive cooperation: Isolated / Collaborative / Integrated
3. Creating morphological matrix, showing all combinations.
4. Selecting coherent, interesting combinations for detailed scenario development, as not all combinations will be equally plausible or interesting.
• Slow tech adoption & Light regulation & Isolated competition equals to Fragmented Markets scenario
• Rapid tech adoption & Heavy regulation & Collaborative competition equals to Regulated Ecosystems scenario
5. Developing detailed scenarios for chosen combinations
Advantage over 2x2 matrix
The morphological analysis captures greater complexity whilst remaining systematic. With three variables at three states each, one can have 27 possible combinations, while selecting 5-7 that represent distinct strategic territory.
Possible disadvantages
The morphological analysis is potentially harder for stakeholders to engage with.
Guidance
One should use the 2×2 matrix for most applications, and use morphological analysis only when additional complexity captures truly important strategic variation that 2×2 misses.

Developed by Jim Dator, University of Hawaii, these archetypes represent recurring patterns of change that help organisations explore multiple possible futures rather than relying on a single predicted outcome. It provides structured alternative to uncertainty-based scenarios (like 2×2 matrices).
Rather than asking ‘what if this variable goes high or low?’, archetypes ask ‘what if the future follows this fundamental pattern?’. They generate deeper narrative richness and prevent blind spots by ensuring you explore growth, constraint, transformation, and collapse possibilities simultaneously.
• Grow
This archetype envisions a future where current trends continue without major disruptions. Economic expansion persists, technological progress advances steadily, and societal structures remain relatively stable. Organisations in this scenario focus on scaling operations, expanding markets, and optimizing existing business models. However, over-reliance on this archetype can create vulnerabilities to unexpected disruptions and may discourage transformative innovation.
Strategic implications:
• Current business model can scale and evolve
• Market expansion opportunities exist
• Technological investment pays off
• Early adoption of emerging technologies creates advantage
• Growth mindset and capability building essential
Strategic questions:
• How does the brand succeed if markets keep expanding?
• What new markets or customer segments open up?
• How does the business scale operations and capabilities?
• What technological investments accelerate growth?
• Collapse
This archetype describes futures characterized by significant crises, breakdowns, or system failures. This could involve economic crashes, environmental catastrophes, political instability, or cascading infrastructure failures. Organisations must prioritize resilience, liquidity, crisis management, and rapid adaptation to survive in such environments. This archetype forces consideration of worst-case scenarios that many prefer to avoid but are critical for comprehensive planning.
Strategic implication:
• Simplification and essential value focus necessary
• Local production and short supply chains advantageous
• Trust and transparency become survival factors
• Luxury and non-essential offerings become liabilities
• Community relationships and reciprocity critical
• Resilience and adaptability determine survival
Strategic questions:
• What is the brand’s essential value in crisis?
• How does the brand serve when systems break down?
• Can the business operate with fragmented supply chains?
• What can it produce or deliver locally?
• Who trusts the brand when institutions fail?
• Discipline
This archetype envisions a future where society transitions toward sustainability and equilibrium. Environmental limits become binding, resource scarcity drives circular economy adoption, and regulatory frameworks tighten around responsibility. Organisations succeed by redesigning business models around efficiency, transparency, and stakeholder value rather than growth. This archetype emphasizes long-term thinking and purposeful positioning, forcing organisations to transform fundamentally rather than optimize existing approaches.
Strategic implications:
• Sustainability becomes competitive requirement, not differentiator
• Supply chain transparency and ethics essential
• Product lifecycle and material choices critical
• Stakeholder relationships trump shareholder returns
• Efficiency and circular design necessary for survival
• Purpose-alignment determines brand loyalty
Strategic questions:
• How does the brand operate in a constrained world?
• Can the business model become circular?
• Are the business’ supply chains ethical and transparent?
• Does the brand’s purpose align with sustainability?
• What becomes waste the organisation must eliminate?
• Transform
This archetype describes futures disrupted by breakthrough innovations or cultural awakening. Established competitive advantages become obsolete, entire industries disappear, and new categories emerge rapidly. Organisations must embrace rapid innovation, abandon legacy constraints, and reimagine value propositions entirely. This archetype demands organisational agility, willingness to cannibalize existing models, and unexpected partnerships. Success requires permitting unlearning alongside learning to navigate discontinuous change
Strategic implication:
• Your industry category might become irrelevant
• Competitive advantage comes from reimagining fundamentals
• First-mover advantage in new categories crucial
• Organisational agility and unlearning necessary
• Partnerships with unlikely players create advantage
• Legacy assets might become liabilities
Strategic questions:
• What if the brand’s entire industry category transformed?
• What new need could the brand serve differently?
• How might the business customers’ lives change fundamentally?
• What partnerships or convergences become possible?
• What would the organisation need to unlearn?
Using the 4 archetypes
1. Starting with current strategy and assumptions to develop four distinct scenario narratives, one for each archetype, anchored in the organisation’s specific industry, region, and context using real evidence and signals.
It is essential to identify a timeline, mapping future events in regard to a specific time horizon.
2. Identifying drivers and forces for each archetype, considering social, technological, economic, environmental, and political (STEEP) factors.
3. Mapping current strategies against each archetype: do strategies work across all four? Which archetypes expose vulnerabilities? Which create opportunities the brand is not prepared for?
E.g.:
• Growth archetype: current strategy works well, as it assumes continuing expansion.
• Discipline archetype: current strategies are vulnerable, as supply chain is not circular and they are not values-aligned.
• Transformation archetype: current strategy is uncertain, as it depends on disruption type and speed.
• Collapse archetype: current strategies are exposed, too reliant on complex supply chains, not resilient.
4. For each archetype, identifying signals indicating it’s gaining probability:
• Growth: watching for sustained capital flows, productivity gains, market expansion
• Discipline: monitoring regulatory tightening, resource prices, consumer values shift
• Transformation: tracking technological breakthroughs, cultural shifts, rare-event patterns
• Collapse: noting infrastructure decay, trust erosion, supply chain fragility
5. Using the scenarios to pressure-test existing strategies across all four archetypes. This reveals vulnerabilities, blind spots, and opportunities that would be invisible in single-forecast planning.
Exercise
1. The Headline, one sentence: ‘In the [Archetype] future, [what fundamentally changes?]’
2. Brand’s Essential Value: ‘In this world, customers need us to [do what?]’
3. Current Advantage: ‘We’re well-positioned because [existing strength relevant to this future]’
4. Critical Gap: ‘We’d struggle with [capability or asset we lack]’
5. Response Strategy: ‘We’d need to [specific shifts in product, service, capability, or model]’
E.g.: Fashion Brand
1. Growth Archetype:
• Headline: ‘Luxury and lifestyle consumption continue expanding’
• Essential Value: ‘Enable self-expression through accessible style’
• Current Advantage: ‘Strong digital presence, efficient production’
• Critical Gap: ‘Limited sustainability credentials’
• Response: ‘Invest in circular fashion, sustainable materials, transparency’
2. Discipline Archetype:
• Headline: ‘Fashion becomes constrained, sustainable, ethical’
• Essential Value: ‘Provide timeless, durable, ethically-made clothing’
• Current Advantage: ‘Quality product heritage’
• Critical Gap: ‘Supply chain opacity; insufficient circularity’
• Response: ‘Complete supply chain transparency; design for longevity and recycling’
3. Transformation Archetype:
• Headline: ‘Virtual and digital fashion replace physical clothing for many’
• Essential Value: ‘Express identity through digital avatars and virtual clothing’
• Current Advantage: ‘Brand heritage and community’
• Critical Gap: ‘No digital/metaverse experience; no virtual products’
• Response: ‘Enter digital fashion; partner with gaming/metaverse platforms’
4. Collapse Archetype:
• Headline: ‘Consumption minimises; local production dominates’
• Essential Value: ‘Provide essential, locally-made clothing’
• Current Advantage: ‘Global manufacturing capability’
• Critical Gap: ‘Depends on global supply chain; no local production’
• Response: ‘Develop local micro-production models; focus on durability and repair’
When traditional scenario planning feels constraining, the Integrated Scenario Framework can create four scenario types based on different strategic purposes rather than critical uncertainties.
Four scenario types
• Preferred Scenario
• The future the organisation actively wants to create
• Aligns with brand vision and values
• Represents optimal stakeholder outcomes
• Guides strategic objective setting, inspirational but still plausible
• Disowned Scenario
• The future the organisation wants to avoid
• Represents feared outcomes and strategic failures
• Helps identify risks and vulnerabilities
• Guides defensive strategy development
• Integrated Scenario
• A balanced future acknowledging both positive and negative aspects
• Reflects realistic complexity and trade-offs
• Balances multiple stakeholder interests
• Outlier Scenario
• A surprising future challenging conventional assumptions
• Forces consideration of discontinuous change
• Tests strategic flexibility and resilience
• Generates innovative strategic options
• Often least likely but potentially most strategically valuable
Advantages
• Explicitly recognises that preferred future might not be most probable
• Forces consideration of risks and defensive strategies
• Explores surprising possibilities that challenge assumptions
• Works well with stakeholders uncomfortable with pure probability-based scenarios
Limitations
• Less systematic than uncertainty-based approaches
• Requires clear preference and fear articulation
• May not balance exploration across possibility space evenly

It was developed by Fuel4Design and widely used in design futures and foresight practice, as it bridges the gap between scenario narratives and lived experience. This tool can be thought as the customer journey exercise but projected into the future.
Using the tool
1. Selecting one scenario among the ones developed
2. Creating a future persona, a typical customer/stakeholder in that scenario, with their basic characteristics, values, aspirations.
3. Mapping their typical day, chronologically from morning to evening:
• Wake-up/Morning: how do they start? what tech/services do they use?
• Commute/Travel: how do they move through the world?
• Work/Primary Activity: what occupies most of their time? Tools/platforms?
• Consumption/Leisure: what do they buy, watch, consume?
• Social Interactions: who do they connect with? How?
• Evening/Rest: how do they wind down?
4. Identifying touchpoints with the brand
• Where and how does the brand fit into this day?
• What problems does it solve?
5. Surfacing insights:
• What was surprising?
• What became obvious?
• What gaps exist?
E.g.:
• Brand X, ‘Hyper-Connected Affluence’ scenario (2040)
• Persona: Aisha, 35, urban professional, sustainability-conscious
• A Day in Aisha’s Life:
- 6am: wakes to AI assistant adjusting lighting and temperature based on her sleep data
- 7am: AI recommends personalised breakfast options based on her health metrics and local sustainable suppliers
- 8am: commutes via autonomous vehicle that personalises journey based on her mood
- 9am-5pm: works in augmented reality office with global colleagues; breaks include personalised wellness suggestions
- 6pm: AI curates dinner reservation at restaurant matching her sustainability values and current mood
- 8pm: relaxes with immersive entertainment in metaverse space
- 10pm: wearables track all data for continuous health optimisation
• Brand Opportunity: She needs brands that make sustainable living effortless and visible as she values transparency and AI-curated choices aligned with her values.

Its purpose is to transform abstract scenarios into tangible experiences by creating artefacts from imagined futures, moving beyond written descriptions to create visceral understanding of scenario implications.
Core technique
• Future Artefact
Artefact force consideration of concrete details rather than remaining abstract: what would our website look like? How would we communicate? What products would we offer? Here, the goal is to create physical or digital objects that would exist in the scenario:
• Product prototypes reflecting new customer needs
• Marketing materials or communication styles from future brand
• News articles describing scenario events
• Company documentation from future organisational states
• Physical spaces or environmental designs
• Speculative Prototyping
Prototyping reveals practical implications and unforeseen challenges of scenario conditions, building working prototypes of products, services, or experiences that would be necessary in specific scenarios:
• Technology interfaces for new customer interaction models
• Service blueprints for evolved customer journeys
• Organisational structures for different business environments
• Critical Design Scenarios
Forces examination of hidden costs and unintended consequences of strategic choices, creating provocative scenarios challenging assumptions about desirable futures:
• What if our most successful scenario were to create unintended negative consequences?
• How might our preferred future exclude important stakeholders?
• What if achieving our vision required compromising core values?
• Speculative Storytelling
Narratives create empathetic understanding, helping teams recognise implications from different stakeholder perspectives, creating narrative accounts of days in scenario futures: what it’s like to be a customer, employee, or competitor in this future?
• A day in the life of customer personas in each scenario
• Competitor narrative describing their strategic moves
• Employee experience description
• Supply chain partner perspective
• Regulatory body perspective
Integration with other tools
Design fiction works particularly well after scenario development. Once abstract scenarios exist, creating artefact makes them tangible. Artefact can be used to test strategic options: ‘Would this service work in Scenario A given these constraints?’, and so on.
DEEP ANALYSIS & PROBLEM SOLVING

It was developed by Dr. Sohail Inayatullah (1998), building on post-structuralist theory and indigenous knowledge systems. CLA has evolved through applications across governance, education, sustainability, and business transformation.
Its purpose is to uncover deeper assumptions and worldviews underlying surface trends and events. It reveals why surface-level interventions often fail and where transformational change requires work at deeper narrative levels.
CLA transforms strategic thinking from ‘How do we respond to this problem?’ to ‘What fundamental beliefs and systems are creating this problem in the first place?’.
It can be used for pattern recognition, critical uncertainties, strategic implications analysis, an dstrategic options.
The Four Layers of CLA
CLA operates through four nested levels, each progressively deeper and more fundamental. Understanding all four levels prevents strategic initiatives from being undermined by deeper contradictions.
• Layer 1: Litany (The Surface Level or Data)
It is what everyone talks about, the obvious, surface-level description of the problem, phenomenon, or trend. This is where news stories focus, where statistics are reported, where immediate reactions occur.
Question: What is the situation? What is the obvious problem everyone sees?
Characteristics:
• Quantitative data and statistics
• Obvious problems and visible symptoms
• Media narratives and public conversation
• Often triggers reactive responses: helplessness (‘What can I do?’), apathy (‘Nothing can be done!’), or projected action (‘Why don’t authorities do something?’)
Simplifications and generalisations
• What appears in headlines and casual conversation
E.g.: Declining Customer Loyalty
• Customer retention rates dropping 15% year-over-year
• Increased price sensitivity in customer research
• More frequent switching to competitors
• Negative social media sentiment
• News story framing: ‘Customers now abandon loyalty for best deal’
• Reactive response: ‘We must improve our loyalty programme immediately!’
• Layer 2: Systemic Causes (Social Systems or Structures)
The structures, policies, and mechanisms that sustain and create surface-level phenomena.
Question: What systems and structures sustain litany situations? What policies, incentives, or mechanisms, what systems are creating these outcomes?
Characteristics:
• Political, economic, social, technological, legal, cultural, and historical factors
• Policies, incentives, and disincentives
• Structural arrangements that make current outcomes inevitable
• Often invisible unless specifically examined
• Require understanding of causation rather than just correlation
• Include both intended and unintended consequences of systems
E.g.: Declining Customer Loyalty
• Digital transformation: Increased competitive options through digital marketplaces and comparison platforms
• Economic structures: reduced switching costs due to standardisation and commoditisation
• Information systems: price transparency enabling instant comparison across competitors
• Business models: subscription-based models changing customer relationship expectations
• Technology: Platform algorithms promoting competitor visibility to existing customers
• Market structure: Consolidation reducing true differentiation among competitors
• Layer 3: Worldviews (Discourse or Cultural Level or Origin event)
The deeper beliefs, values, and paradigms that give legitimacy to the systems. What is considered ‘normal’, ‘natural’, ‘inevitable’, or ‘right’ about the situation. They are often actor-independent, cultural rather than individual.
Question: What worldview supports and justifies these systems? What beliefs about how the world works make this situation seem inevitable or natural?
Characteristics:
• Shared beliefs about how the world works
• Value systems that seem obvious or universal but are actually culturally specific
• Authority, power structures embedded in worldviews
• Often unquestioned assumptions
• Drive what policies and systems seem acceptable
• What ‘everyone knows’ is true
• Often conflict between different worldviews creates strategic tension
E.g.: Declining Customer Loyalty
• Consumer empowerment ideology: ‘The customer is always right’ and has ultimate power
• Market efficiency beliefs: Perfect information and transparency benefit everyone
• Individualism and autonomy matter more than collective benefit or loyalty
• Markets work through competition, not cooperation
• Scepticism toward authority: customers don’t trust brands but market forces
• Transactional thinking, where relationships are contracts not emotional connections
• Speed and efficiency values: fast switching and optimisation are desirable
• Layer 4: Myths and Metaphors (Archetypal Level or Deep Stories and Collective Narratives)
The foundational narratives, collective archetypes, and metaphorical structures that shape how we see reality. They operate largely unconsciously. They’re patterns of meaning that touch emotion more than logic.
Question: What myths, metaphors, or narrative archetypes are operating? What touches the heart rather than just the mind? What stories do we tell that make this situation feel inevitable?
Characteristics:
• Collective archetypes and unconscious dimensions
• Metaphors that frame how we understand situations
• Narrative patterns that feel emotionally true rather than logically proven
• Often cultural or civilisational in scope
• Very difficult to change because they operate below conscious awareness
• What people intuitively ‘feel’ is right
• Often paradoxical or contradictory at the logical level but emotionally coherent
E.g.: Declining Customer Loyalty
• Metaphor of customer as ‘king’ or ‘sovereign’: The customer reigns supreme; brands serve at customer pleasure
• Myth of the ‘free market’ as natural law: Markets are natural systems like weather, not human creations
• Narrative of progress through choice: More options = more progress; unlimited choice = ultimate freedom
• Story of inevitable commoditisation: Everything eventually becomes commodity; differentiation is temporary
• Metaphor of business as ‘warfare’: Companies are competitors locked in battle; win-lose not win-win
• Image of loyalty as weakness: Being loyal means one has stopped shopping around and missing better deals
• Archetype of the hero: The individual consumer as hero, shopping around, maximising personal benefit
Using the Casual Layered Analysis
CLA works through three distinct phases, each with different purpose and direction of analysis.
• Phase 1: Downward Analysis (Litany > Myths)
The aim here is to diagnose the current situation by understanding what creates it at all levels, moving from surface symptoms down to increasingly deeper levels.
1. Starting with litany, defining surface-level problems or trends everyone recognises
Identify systems (What structures, policies, and mechanisms create this litany?)
• What economic incentives drive these outcomes?
• What technologies enable this situation?
• What policies support or maintain it?
• What organisational structures make this inevitable?
2. Examining worldviews (What beliefs and values justify these systems?)
• What is considered legitimate or normal?
• What values drive system design?
• What power relationships are embedded?
• What assumptions are we making?
3. Uncovering myths and metaphors (What deep stories and archetypes operate here?)
• What metaphors frame how we see this?
• What narratives make this feel inevitable?
• What collective stories are we telling?
• What emotions are attached?
• Phase 2: Value Transformation
The aim here is to consciously choose which values and assumptions one wants to challenge and change. By transforming values at deeper layers such as shifting worldviews and myths, one automatically transforms what can become possible at system and litany levels.
Transformation questions:
• Which beliefs or assumptions are limiting us?
• What alternative worldviews might be more generative?
• What different myths or metaphors could frame this situation?
• How do alternative values at deeper layers create different possibilities?
Example value shifts:
• Customer as sovereign king > Customer as partner in co-creation
• Competition as inevitable > Collaboration as possible
• Loyalty as constraint > Loyalty as intelligence
• Transactional relationships > Relationship-based value creation
• Market efficiency as highest value > Human flourishing as highest value
• Phase 3: Upward Analysis (Myths > Litany for Alternative Future)
The aim here is to build an alternative future by reconstructing all four levels based on transformed values, moving from deeper levels upward, designing new myths and systems that would create substantially different surface-level reality.
1. Reimagining myths and metaphors (What new narratives would support desired future?)
• Create new metaphors for customer relationships
• Develop counter-narratives to limiting stories
• Find archetypes that support transformation
• Build stories that touch emotion and imagination
E.g.: Replacing ‘customer as sovereign king’ with ‘customer as co-creator in shared journey’.
2. Designing alternative worldviews (What beliefs and values would support desired future?)
• What values should guide system design?
• What assumptions would be different?
• What would be considered legitimate or normal?
• What power relationships would change?
E.g.: Replacing ‘transactional efficiency’ with ‘relationship-based mutual benefit’.
3. Structuring new systems (What structures and policies would align with new worldview?)
• What incentives would reinforce new values?
• What organisational structures would support transformation?
• What policies would embody new worldview?
• What technologies would enable desired outcomes?
E.g.: Integrated service platforms, shared value mechanisms, community structures.
4. Describing new litany (What would surface-level reality look like?)
• What trends would emerge?
• What would people talk about?
• What data would we see?
• What would headlines say?
E.g.: ‘Customers choose brands for partnership and shared values, not lowest price’
Strengths
• Reveals why surface interventions fail
• Creates leverage for transformational change
• Builds shared understanding across diverse perspectives
• Identifies hidden assumptions and contradictions
• Generates emotional commitment through narrative transformation
Limitations
• Time-intensive (full workshop requires 2-3 hours minimum)
• Requires skilled facilitation to manage complexity
• Can feel abstract for action-oriented teams
• Difficult to measure impact of myth-level changes
• Works best with stakeholder diversity; homogeneous groups may struggle
• Emotional resistance to challenging foundational beliefs
Best Used For
• Fundamental strategic challenges resistant to incremental solutions
• Situations where different stakeholders see the world very differently
• Transformation initiatives requiring cultural change
• Identifying why past strategies haven’t worked
• Designing truly innovative approaches
• Not situations where only systems-level change is needed
Its purpose it to prepare for low-probability, high-impact events that scenario planning cannot capture. It builds resilience and rapid response capability.
Types of Wild Cards (or Discontinuities)
• Black Swans
- Completely unpredictable events with massive impact. By definition, they cannot be specifically predicted, but their general possibility can be acknowledged.
- Examples: Pandemics, geopolitical shocks, technological breakthroughs, financial system collapses, natural disasters
- Strategic response: building general resilience and adaptive capacity rather than specific responses
• Grey Rhinos
- High-probability, high-impact threats being collectively ignored, often because implications seem too disruptive or politically inconvenient.
- Examples: Climate change impacts, demographic transitions, infrastructure decay, social inequality acceleration, automation displacement
- Strategic response: acknowledging obvious threats, prepare specific responses, advocate for broader action
• Black Elephants
- High-probability events in collective denial, combining Black Swan unpredictability with Grey Rhino visibility.
- Examples: Supply chain disruption despite warning signs, regulatory backlash against problematic practices, generational value shifts undermining business models
- Strategic response: breaking through denial, surface implications, develop response strategies
• Dragon Kings
- Predictable extreme events in complex systems
- Rare but not unprecedented; patterns exist
- Examples: Market crashes, supply chain failures, reputation cascades
- Preparation approach: understanding systemic vulnerabilities
Pre-mortem imagines that implemented strategy has failed and works backward to identify potential causes.
Using the analysis
1. Imagining each strategic option has failed completely
2. Working backwards to identify potential causes:
• What internal factors could derail this?
• What external events could cause failure?
• What assumptions, if wrong, would cause failure?
• What chain reactions could occur?
3. Cross-referencing with potential wild cards:
• Which wild cards would trigger specific failure modes?
• What combinations of events would overwhelm resilience?
• Where are cascade points where small disruptions create large effects?
4. Designing resilience:
• Building redundancy around critical failure points
• Creating early warning systems for key risk factors
• Developing rapid response capabilities
• Establishing decision criteria for strategic pivots
• Investing in flexibility and adaptability rather than only optimisation
• Create backup strategies for critical functions
E.g.:
• Strategic option: ‘Invest heavily in proprietary AI technology to create competitive advantage’.
• Pre-mortem failure scenario: ‘Three years in, competitors accessed equivalent AI through cloud services, cost us 5x more than theirs. We couldn’t scale fast enough, customers switched to competitors, investment became sunk cost’.
• Cause analysis:
- Assumption that proprietary tech remains proprietary is proved wrong (cloud democratised access)
- Expected scaling timeline too optimistic
- Cost model inadequate for competitive situation
- Market moved faster than anticipated
• Resilience responses:
- Building modular capability enabling shift to cloud services if needed
- Creating partnership agreements with cloud providers as backup
- Monitoring cloud AI pricing and capability progression
- Building decision criteria for shifting strategies if competitive dynamics change
- Developing hybrid approaches not wholly dependent on proprietary tech
STRATEGIC OPTIONS EXPLORING & TESTING
Amory Lovins (1976-1977) first proposed ‘backwards-looking analysis’ for energy policy, then John Robinson (1982) coined the term ‘backcasting’ and formalised the methodology. It evolved through sustainable development applications in 1990s Netherlands (Quist and Vergragt) emphasising stakeholder participation.
Its purpose is to define an aspirational end state, then work backward to identify necessary steps, dependencies, and timing that connects present to desired future. Forward-looking planning often gets constrained by current assumptions and capabilities, so backcasting allows for alternative thinking by starting with desired outcome and working backward to feasible pathways.
There is one core question to make backcasting work: ‘What would need to happen for our preferred future to be realised?’ rather than ‘What’s likely to happen?’
How to use backcasting
1. Defining preferred future clearly and specifically:
• What does success look like in 10-20 years?
• How has the brand evolved by that point?
• What relationships exist?
• What capabilities does it possess?
• What role does it play in its ecosystem?
2. Identifying critical waypoints working backwards:
• Year 7-10: What major developments should have happened?
• Year 5: What foundational capabilities must be in place?
• Year 2-3: What initial shifts must occur?
• Year 0-1: What needs to start immediately?
• What must be true 5 years out for 10-year vision to be achievable?
• What must be in place at 3 years?
• What must begin in next 18 months?
• What must happen in next 6 months?
3. For each waypoint:
• What needs to be true about the brand (capabilities, culture, relationships)?
• What needs to be true about the market (customer needs, competitive dynamics)?
• What foundations must be built first?
• What external developments need to occur?
• What decisions or commitments are required?
4. Identifying dependences:
• Which capabilities enable others?
• Which waypoints are prerequisites for others?
• Where are critical decision points?
• Where might alternative pathways diverge?
5. Connecting to present actions:
• What specific initiatives should start immediately?
• What resources are required?
• What capabilities need development?
• What risks require mitigation?
6. Testing feasibility:
• Is the pathway realistic given known constraints?
• What barriers might prevent progression?
• What assumptions underlie the pathway?
It is important to remember that strategic foresight prepares for multiple futures instead of forecasting a single one.
• Forecasting asks: ‘What’s likely to happen?’
• Backcasting asks: ‘What needs to happen for our vision to be realised?’
• Forecasting assumes future is largely determined by current trends
• Backcasting assumes future is shaped by strategic choices and deliberate action
Variations
• Participatory Backcasting: directly involving diverse stakeholders in identifying what needs to happen.
• Transition Scenarios: creating intermediate scenarios between present and 20+ year vision (e.g., 5-year, 10-year, 15-year waypoints).
• Backcasting Wheel: using structure similar to Futures Wheel to map consequences of achieving waypoints.
Example application
Aspirational future (10 years): ‘Industry-leading sustainability brand trusted by conscious consumers, operating fully circular business model with net-positive environmental impact’.
• Working backward
• Year 5: Circular economy operations scaled, supplier network transformed, customer loyalty rebuilt around sustainability
• Year 3: Circular operations piloted, supply chain beginning transformation, sustainability positioning established
• Month 18: Circular pilot launched, supplier partnerships initiated, sustainability communications started
• Month 6: Circular pilot designed and funded, key suppliers engaged, communication strategy developed
• This backcasting immediately reveals: ‘The next 6 months are critical for setting direction. Supplier relationships are foundational, so we must prioritise these. Sustainability claims require credibility building before scaling’.
Integration with other tools
Backcasting combines naturally with scenario development and strategic options (backcasting identifies which options are prerequisites for later possibilities).

The framework emerged from McKinsey’s work in the early 2000s, and articulated by Baghai, Coley, and White in their 2000 publication ‘The Alchemy of Growth’. It provides a structured method for organising strategic initiatives across different time horizons and risk levels, thus enabling organisations to simultaneously address three distinct strategic challenges: optimising current performance, exploring emerging opportunities, and preparing for transformational possibilities. The Framework is mostly used for strategic options, planning & roadmapping.
Most organisations focus exclusively on immediate performance, what is in Horizon 1, creating vulnerability when established business models become obsolete. Simultaneously pursuing opportunities across three horizons creates, instead, balanced portfolios that ensure current viability whilst building future resilience and growth.
• Horizon 1 (now, well known)
• Focus: Maximising performance and profitability of established business.
• Time Frame: Immediate to short-term (0-2 years)
• Characteristics:
- Familiar markets and customer bases
- Established products, services, and business models
- Known competitive dynamics
- Predictable cash flows and returns
- Clear measurement metrics and success indicators
- Lower risk, more certain outcomes
• Resource Allocation: Typically 70-80% of strategic effort and resources
• Strategic Objectives:
- Operational excellence and efficiency improvements
- Customer experience enhancement and satisfaction
- Market share protection and modest growth
- Quality and reliability improvements
- Cost reduction and margin optimisation
- Incremental innovation within established categories
• Examples for Brand Strategy:
- Improving website user experience and conversion rates
- Enhancing customer service responsiveness
- Streamlining supply chain and reducing costs
- Launching incremental product improvements
- Expanding distribution in existing markets
- Building loyalty programmes
- Enhancing brand communications and positioning refinement
• Key Success Factors:
- Clear performance targets and metrics
- Disciplined execution and project management
- Focus on customer satisfaction and retention
- Continuous improvement culture
- Strong stakeholder alignment
• Risk of Imbalance:
When over-emphasis is on Horizon 1 organisations focus on maximising current model and fail to prepare for disruptions or shifting needs.
• Horizon 2 (near future, emerging innovations, new to the brand)
• Focus: Exploring emerging opportunities in adjacent markets, new customer segments, or extended product/service lines.
• Time Frame: Medium-term (2-5 years)
• Characteristics:
- Partially familiar markets and customer bases
- Somewhat novel products, services, or business models
- Emerging competitive dynamics
- Less predictable cash flows; higher uncertainty
- Mixed new and established metrics
- Moderate risk, outcomes less certain than Horizon 1
• Resource Allocation: Typically 20-30% of strategic effort and resources
• Strategic Objectives:
- Expand into new but related market segments or geographies
- Develop product or service line extensions
- Experiment with emerging technologies and capabilities
- Build strategic partnerships and alliances
- Test new business model variations
- Develop emerging technology adoption
- Explore new customer relationship models
• Examples for Brand Strategy:
- Entering adjacent market segments (e.g., luxury brand launching accessible line; local brand expanding geographically)
- Developing new product categories serving similar customer needs differently
- Exploring new distribution channels (e.g., direct-to-consumer alongside retail)
- Building digital platforms complementing physical offerings
- Creating partnerships enabling new service delivery
- Testing subscription models alongside transactional sales
- Experimenting with sustainability positioning in new markets
• Key Success Factors:
- Clear definition of ‘adjacent’, far enough to avoid cannibalising Horizon 1, close enough to leverage existing capabilities
- Tolerance for experimentation and learning from failure
- Cross-functional teams with Horizon 1 and 3 perspectives
- Pilot approaches testing concepts before scaling
- Clear escalation criteria for moving successful pilots to growth
• Risk of Imbalance: Under-emphasis on Horizon 2 leaves organisations unprepared for market transitions. Over-emphasis can distract from Horizon 1 performance or create too many scattered experiments draining resources without coherent direction.
• Horizon 3 (far future, disruptive innovations, new to the industry)
• Focus: Preparing for fundamentally different futures through exploratory investments and capability building.
• Time Frame: Long-term (5+ years)
• Characteristics:
- Unfamiliar markets and customer bases
- Novel products, services, or business models
- Uncertain competitive dynamics; potential new competitors from unexpected sources
- Highly unpredictable cash flows and returns
- New metrics required; success measures often non-financial
- High risk, highly uncertain outcomes
• Resource Allocation: Typically 5-10% of strategic effort and resources
• Strategic Objectives:
- Develop new business models or value propositions
- Invest in disruptive technology development
- Explore fundamental market repositioning
- Build entirely new customer relationships or ecosystems
- Create new organisational forms or operating models
- Test emerging technological capabilities at scale
- Prepare for industry transformation
• Examples for Brand Strategy:
- Developing entirely new brand expressions serving fundamentally different markets
- Investing in emerging technologies that could transform service delivery
- Exploring new organisational forms (cooperatives, platforms, networks)
- Building capabilities for potential business model transformation
- Experimenting with radical sustainability or social value propositions
- Exploring convergence with adjacent industries
- Preparing for industry consolidation or disruption scenarios
• Key Success Factors:
- Senior leadership commitment and protection from quarterly pressure
- Portfolio approach (many experiments, expect most to fail)
- Learning orientation rather than immediate profitability
- Separation from Horizon 1 pressures to avoid being killed by short-term thinking
- Willingness to fundamentally challenge current assumptions
• Risk of Imbalance: Under-emphasis on Horizon 3 leaves organisations vulnerable to disruption and unable to capitalise on transformation opportunities. Over-emphasis can create organisational distraction and waste resources on unfocused experimentation whilst undermining current business.
• Critical understanding: Horizon 1 metrics are not to be applied to Horizon 3 initiatives. Most Horizon 3 projects will ‘fail’ by Horizon 1 standards (low short-term returns, high uncertainty) but succeed strategically (build capabilities, create options, generate learning).
Using Three Horizons for Strategic Portfolio Balance
The framework’s real power emerges through managing the tension between horizons and ensuring that each receives appropriate attention and resources whilst preventing one from overwhelming others, while additionally keeping in mind one’s own organisationals capabilities and maturity.
• Canonical allocation:
- Horizon 1: 70-80% of current resources (based on industry and life cycle)
- Horizon 2: 15-25% of current resources
- Horizon 3: 5-10% of current resources
Current business must fund both operations and future exploration. However, actual allocations should vary based on strategic context:
- Startup or Emerging Brand: Might emphasise Horizon 2-3 (60-80%) whilst building Horizon 1 foundation
- Mature Industries: Might maintain higher Horizon 1 (80%+) initially, gradually shifting allocation as disruption signals strengthen
- High-Growth Industries or Disrupted Markets: Might increase Horizon 2 to 30-35% and Horizon 3 to 10-15%, reflecting rapid change
• Key principle: Allocation should be intentional, not accidental. If Horizon 3 receives 0% of resources, that’s a strategic choice (assuming no transformation expected). If Horizon 2 gets absorbed into Horizon 1 activities, acknowledge that and recalibrate.
Three Horizons Portfolio Composition
Beyond resource allocation, one should consider strategic portfolio composition, namely what types of initiatives populate each horizon.
• Horizon 1 portfolio typically includes:
- Operational efficiency and cost reduction projects
- Customer experience and satisfaction initiatives
- Market share growth in established segments
- Product quality and reliability improvements
- Technology maintenance and system updates
- Brand reinforcement and communication
- Channel expansion in familiar markets
- Incremental product improvements
• Horizon 2 portfolio typically includes:
- Geographic or market segment expansion (new but related)
- Adjacent product line development
- New customer relationship models (e.g., subscription, direct)
- Partnership and alliance development
- Emerging technology pilots and adoption
- New channel development
- Platform or ecosystem experimentation
- Capability building for potential future needs
• Horizon 3 portfolio typically includes:
- Disruptive technology exploration and investment
- Business model innovation and experimentation
- Industry boundary exploration and convergence
- Radical sustainability or social purpose exploration
- Emerging market and customer exploration
- Organisational form and structure experimentation
- Fundamental repositioning or reinvention
- New industry ecosystem participation
Integration with other tools
The Three Horizons integrates powerfully with other strategic foresight tools, especially with scenario building, backcasting, futures triangle, impact/uncertanty matrix and CLA.
• With futures triangle:
- Horizon 1: Often dominated by ‘Weight of History’ (legacy systems, established practices)
- Horizon 2: Balances all three forces (building on strengths, riding emerging trends, overcoming constraints)
- Horizon 3: Often dominated by ‘Pull of Future’ (aspiration-driven)
• With Impact/Uncertainty matrix:
- High-impact, low-uncertainty factors: Incorporate across all horizons
- High-impact, high-uncertainty factors: Foundation for Horizon 2-3 strategy
- Low-impact factors: Primarily Horizon 1 tactical concerns
• With Casual Layered Analysis (CLA):
- Horizon 1 interventions: Typically litany and systems level
- Horizon 2 interventions: Systems and worldview level
- Horizon 3 interventions: Worldview and myth/metaphor level
Here, Horizon 3 requires deeper cultural and narrative change.
Three Horizons for Small Brands and Startups
Adapted appropriately, the Three Horizons works for smaller organisations.
Small Brand Horizon Adaptation:
• Horizon 1: Core offerings generating primary revenue; established customer base. Current product/market; paying customers and revenue generation.
• Horizon 2: One or two strategic pilots (new market, new offering, new partnership). Early expansion opportunities (new segments, extensions, markets)
• Horizon 3: Exploratory capabilities or market experiments (even if tiny investment). Emerging possibilities informed by market learning; building for potential scale.
The key is to balance present performance with future exploration.
The Strategic Power of Three Horizons
The three horizons framework’s ultimate value lies in forcing explicit choices. Rather than allowing resource allocation to happen through default (usually favouring immediate demands), three horizons requires deliberate strategic decision-making:
• How much do we invest in current business excellence versus future transformation?
• What capabilities do we build for emerging opportunities?
• How do we balance stakeholder expectations for near-term returns with long-term resilience?
• How do we maintain current performance whilst building future competitive advantage?
These conversations create strategic clarity, guiding consistent decision-making. They ensure organisations don’t sacrifice the future for the present, but equally don’t sacrifice present viability for speculative futures. They enable balance, thus what Peter Senge calls ‘dynamic tension’ between current success and future possibility.
Its purpose is to create a balanced portfolio of different strategic approaches rather than betting everything on single best option. Under genuine uncertainty, no single strategy succeeds across all possible futures, so the portfolio approach spreads bets across, building resilience whilst maintaining upside potential.
Option types
• No-Regret Moves
Strategies creating value regardless of which scenario emerges. They form portfolio foundation.
Characteristics:
- Work reasonably well across all scenarios
- Often involve capability building or relationship development
- Tend to have lower immediate impact but high resilience
- Create platforms for scenario-specific responses
Examples:
- Improving customer experience (valuable in any scenario)
- Developing employee capabilities (valuable regardless of future)
- Building stakeholder relationships (creates options and resilience)
- Resource allocation: 30-40% of strategic portfolio investment
• Real Options
Investments that create flexibility and future choices without requiring immediate full commitment.
Characteristics:
- Preserve future possibilities without forcing immediate decision
- Enable scaling if conditions prove favourable
- Create learning opportunities
- Cost less than full commitment
Examples:
- Pilot programmes that can scale
- Partnership agreements enableable when needed
- Technology platforms enabling multiple applications
- Market test programmes
- Resource allocation: 30-50% of strategic portfolio investment
• Big Bets
High-risk, high-reward strategies designed for specific scenario conditions. They create breakthrough opportunities when conditions align.
Characteristics:
- Large upside potential
- Significant downside risk
- Require specific scenario conditions
- Can create competitive advantage if successful
Examples:
- Major market repositioning
- Transformational technology development
- Fundamental business model innovation
- Market entry into new categories
- Resource allocation: 10-30% of strategic portfolio investment
• Contingent Strategies
Responses triggered by specific conditions, enabling rapid pivots when conditions change.
Characteristics:
- Prepared in advance but not executed until needed
- Enable fast response when trigger conditions occur
- Include decision criteria for activation
- Include resource allocation pathways for rapid scaling
Examples:
- Pre-developed crisis response protocols
- Prepared partnership agreements activatable if needed
- Alternative supply chain pathways available if primary disrupted
- Resource allocation: part of monitoring and capability building (5-10% of resources)
Building a strategic options portfolio
1. Brainstorming potential strategic responses for each scenario
2. Classifying each option by type
3. Assessing resource requirements like financial investment, time, capability
4. Balancing portfolio across:
• Types of options (majority no-regrets foundation, substantial real options, strategic big bets)
• Risk levels (majority lower-risk foundation, significant higher-risk opportunities)
• Time horizons (immediate, 2-5 years, 5+ years)
• Scenarios (which scenarios are addressed by which options?)
5. Creating implementation roadmap specifying:
• What happens in next 6 months
• What becomes active in Year 1-2
• What becomes active in Year 2-5
• What trigger points activate contingent strategies
• How resources get allocated across options
• How learning from early options informs later decisions
Portfolio Stress-Testing
Testing portfolio robustness by considering:
• What if primary no-regret moves fail? Have backup options?
• What if big bets succeed? Can we scale? Do we have capability?
• What if scenarios evolve unexpectedly? Can portfolio adapt?
• Are there dangerous gaps? Scenarios with few strategic options?
TOOLS WITHIN SAKU
Distribution
Tools have been roughly integrated throughout SAKU in this way:

SCAN & SPECULATE
Part 1 (Environmental Scanning & Intelligence Gathering) and 2 (Pattern Recognition & Uncertainty Framing)

ANCHOR
Part 2 (Pattern Recognition & Uncertainty Framing), Part 3 (Scenario Development) and 4 (Deep Analysis & Problem Solving)

KINDLE IDEAS
Part 3 (Scenario Development), 4 (Deep Analysis & Problem Solving) and 5 (Strategic Options Exploring & Testing)
